Category: Blog

  • What Is EPOS? Meaning, Features, Benefits, and How It Works in Retail

    What Is EPOS? Meaning, Features, Benefits, and How It Works in Retail

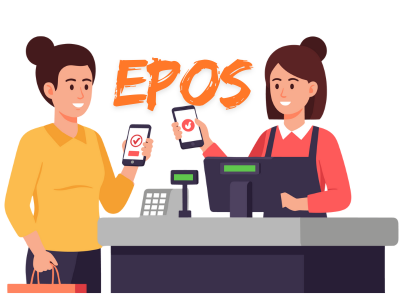
    EPOS (Electronic Point of Sale) is a computerized system used by businesses to process sales transactions and accept payments. It also helps manage inventory, customers, and sales data in real time.

    In today’s fast‑moving retail world, speed, accuracy, and customer experience can make or break a business. Shoppers expect quick billing, multiple payment options, and smooth returns, while store owners need real‑time inventory tracking and clear sales reports. This is where EPOS systems come into play. EPOS, or Electronic Point of Sale, has become the backbone of modern retail operations, replacing traditional cash registers with smart, software‑driven solutions.

    This guide explains what EPOS means, how it works in retail, its main features, key benefits, and why it has become essential for small and large retailers alike.

    What Is EPOS, describe in detail?

    person working at epos

    EPOS (Electronic Point of Sale) is a computerized system used to process sales transactions and manage different parts of a retail business, such as inventory, customers, staff, and reporting. Instead of only recording sales like a cash register, an EPOS system connects hardware and software to create a complete retail management platform.

    An EPOS setup usually includes a touchscreen terminal, barcode scanner, receipt printer, card payment machine, and cloud‑based or local software. Together, these components allow retailers to sell products, accept payments, update stock levels automatically, and store transaction data in one place.

    In simple terms, EPOS in different sectors is the digital heart of a retail store. Every sale, return, discount, or stock update passes through this system .

    Why EPOS Is Important in Modern Retail

    Retail is no longer just about selling products over a counter. Businesses now operate across physical stores, online platforms, and mobile channels. Managing all this manually is slow and error‑prone.

    EPOS systems bring everything together. They help retailers understand what is selling, what is not, who their best customers are, and which products generate the highest profit. With real‑time data and automation, store owners can make better decisions instead of relying on guesswork.

    For small retailers, EPOS reduces daily workload. For large chains, it ensures consistency across multiple locations.

    How an EPOS System Works in Retail

    An EPOS system works by combining hardware and software to handle every step of a sale.

    When a customer brings items to the checkout counter, the cashier scans each product using a barcode scanner or selects it from the touchscreen. The EPOS software instantly retrieves the product name, price, tax rate, and stock level from the database.

    The system calculates the total bill, including discounts or promotions, and displays it on the screen. The customer then pays using cash, card, UPI, wallet, or other digital payment methods supported by the system.

    Once the payment is completed, the EPOS system does several things automatically:

    It records the transaction in the sales database. It updates inventory levels in real time. It generates a receipt for the customer. It stores customer details if loyalty programs are enabled. It updates financial and sales reports.

    All of this happens within seconds, making checkout faster and more accurate.

    Key Components of an EPOS System

    POS machine

    To understand EPOS better, it helps to know what it is made of.

    1. Hardware

    Most EPOS systems include:

    Touchscreen monitor or tablet Barcode scanner Receipt printer Cash drawer Card payment terminal Weighing scale (for grocery or fresh produce stores)

    These devices work together to handle physical transactions smoothly.

    2. Software

    The EPOS software is the brain of the system. It manages:

    Product database Pricing and taxes Inventory tracking Customer data Staff accounts Sales reports

    Many modern EPOS solutions are cloud‑based, allowing store owners to access data from anywhere.

    Main Features of an EPOS System

    A good EPOS system offers much more than basic billing. Below are the most important features retailers look for.

    1. Sales and Billing Management

    EPOS software processes transactions quickly and accurately. It applies discounts, calculates taxes automatically, and supports multiple currencies and payment methods. This reduces billing errors and speeds up checkout lines.

    2. Inventory Management

    Inventory tracking is one of the biggest advantages of EPOS. Every sale updates stock levels automatically. Retailers can see which items are running low, which are overstocked, and which sell the fastest.

    This helps avoid both out‑of‑stock situations and excess inventory.

    3. Barcode and Product Management

    Products can be added with unique barcodes, descriptions, prices, and categories. This makes scanning faster and reduces manual entry mistakes.

    4. Customer Relationship Management (CRM)

    Many EPOS systems store customer information such as names, phone numbers, and purchase history. This helps retailers offer loyalty points, personalized discounts, and targeted promotions.

    5. Staff Management

    Store owners can create separate logins for employees, track working hours, and monitor individual sales performance. This improves accountability and reduces internal theft.

    6. Reporting and Analytics

    EPOS systems generate detailed reports on daily sales, profits, taxes, best‑selling products, and slow‑moving stock. These insights help in planning marketing strategies and improving store performance.

    7. Multi‑Store and Omnichannel Support

    Advanced EPOS software allows retailers to manage multiple stores from one dashboard. It can also sync with eCommerce websites, keeping online and offline inventory aligned.

    8. Cloud Access and Data Backup

    Cloud‑based EPOS systems store data securely online. This protects information from hardware failure and allows owners to check sales reports remotely.

    Benefits of Using EPOS in Retail

    Switching to an EPOS system offers long‑term advantages that go far beyond faster billing.

    a. Faster Checkout Experience

    Customers hate waiting in long queues. EPOS speeds up transactions, which improves customer satisfaction and increases the chances of repeat visits.

    b. Improved Accuracy

    Manual billing often leads to pricing and calculation errors. EPOS reduces mistakes by automating calculations and product selection.

    c. Better Inventory Control

    Retailers can track stock levels in real time, set low‑stock alerts, and avoid losing sales due to unavailable products.

    d. Data‑Driven Decisions

    Instead of guessing which products to reorder or promote, retailers can rely on actual sales data. This leads to smarter purchasing and higher profits.

    e. Enhanced Customer Loyalty

    By storing customer data and purchase history, EPOS systems make loyalty programs easy to manage. Personalized offers help build long‑term relationships.

    f. Reduced Operational Costs

    Automation cuts down the need for manual record‑keeping and reduces staff workload. Over time, this lowers operating expenses.

    g. Business Scalability

    As a business grows, an EPOS system grows with it. New stores, products, or employees can be added without changing the entire setup.

    FeatureEPOS SystemTraditional Cash Register
    MeaningElectronic Point of Sale system with software and hardwareBasic machine for recording sales and storing cash
    Sales ProcessingFast, automated, supports barcodes and digital paymentsManual or semi-automatic billing
    Inventory ManagementReal-time stock tracking and low-stock alertsNot available
    Reporting & AnalyticsDetailed sales, profit, tax, and performance reportsVery limited or none
    Customer ManagementStores customer data and supports loyalty programsNot supported
    Staff ManagementTracks employee sales and work hoursNot supported
    Cloud AccessAvailable in modern EPOS systemsNot available
    Multi-store SupportCan manage multiple branches from one systemSingle store only
    Error ReductionHigh accuracy due to automationHigher chance of manual errors
    Setup CostHigher initial or subscription costLower upfront cost
    Long-term ValueHigh – improves efficiency and reduces lossesLow – limited functionality
    Best ForGrowing and modern retail businessesVery small shops with basic needs

    Types of EPOS Systems

    Different retailers choose different EPOS setups depending on their needs.

    1. Retail EPOS

    Designed for clothing stores, supermarkets, electronics shops, and pharmacies. It focuses on inventory control and fast checkout.

    2. Restaurant EPOS

    Includes table management, kitchen order tickets, and menu customization.

    3. Mobile EPOS

    Runs on tablets or smartphones, ideal for pop‑up shops and small businesses.

    4. Cloud‑Based EPOS

    Stores data online and allows remote access. This is the most popular option today.

    How to Choose the Right EPOS System for Your Store

    Before investing in an EPOS solution, retailers should consider a few factors.

    Business size and type play a major role. A grocery store needs strong inventory tools, while a boutique may focus more on customer management.
    Budget is another key factor. Cloud‑based EPOS systems usually have monthly fees, while traditional systems require higher upfront costs.

    Ease of use matters as well. Staff should be able to learn the system quickly.

    Integration with payment gateways, accounting software, and eCommerce platforms is also important for smooth operations.

    Finally, good customer support from the EPOS provider can save time and frustration in the long run.

    Common Challenges of EPOS Systems

    Although EPOS offers many benefits, it is not without challenges.

    Initial setup costs can be high for small businesses.

    Staff training is required to use the system efficiently.

    Internet dependency can be an issue for cloud‑based systems during outages.

    Data security must be taken seriously to protect customer information.

    Choosing a reliable provider and implementing proper security measures can reduce most of these risks.

    Future of EPOS in Retail

    EPOS technology continues to evolve. Artificial intelligence, machine learning, and advanced analytics are being added to modern systems.

    In the future, EPOS systems will predict customer behavior, automate reordering, and offer deeper insights into buying patterns. Integration with AI assistants and smart devices will further improve efficiency.

    Retailers who adopt modern EPOS solutions early will have a competitive advantage in an increasingly digital marketplace.

    Frequently Asked Questions (FAQs)

    A. What does EPOS stand for?

    EPOS stands for Electronic Point of Sale.

    Is EPOS suitable for small businesses?

    Yes, many affordable cloud‑based EPOS systems are designed specifically for small retailers.

    B. Can EPOS work without the internet?

    Some systems offer offline modes, but full functionality usually requires an internet connection.

    C. Is EPOS better than POS?

    EPOS is a type of POS system. EPOS usually refers to more advanced, computerized setups with inventory and reporting features.

    D. How much does an EPOS system cost?

    Costs vary depending on hardware, software, and features. Prices can range from low monthly subscriptions to higher one‑time investments.

    Final Thoughts

    An EPOS system is no longer a luxury for retail businesses. It is a necessity in a world where customers expect fast service and business owners need accurate data to stay competitive.

    By automating sales, tracking inventory in real time, and providing valuable insights, EPOS systems help retailers save time, reduce errors, and grow their businesses with confidence.

    Whether you run a small neighborhood store or a multi‑location retail chain, investing in the right EPOS solution can transform the way you operate and serve your customers.

  • What Does Q1 Mean? Quarter 1 Explained for Business & Finance

    What Does Q1 Mean? Quarter 1 Explained for Business & Finance

    Q1 stands for Quarter 1, the first three-month period of a calendar year or fiscal year, commonly used in business and financial reporting. For companies following the calendar year, Q1 runs from January 1 to March 31, while businesses using a fiscal year may have a different Q1 timeframe depending on when their financial year begins.

    What Is Q1?

    Q1, short for Quarter 1, refers to the first three months of a year used for business and financial tracking. Instead of reviewing performance once a year, companies break the year into four equal parts, called quarters, to better monitor progress. Q1 is simply the starting quarter, marking the beginning of a new financial cycle.

    Quarters exist because they make it easier for businesses, investors, and analysts to track results regularly, spot trends early, and make timely decisions. By reviewing data every three months, companies can adjust budgets, improve strategies, and respond to changes without waiting until the end of the year.

    Q1 in a Calendar Year

    When a company follows the calendar year, Q1 refers to the period from January 1 to March 31. This is the most common structure used by businesses worldwide because it aligns with the standard January to December calendar. Under this system, the financial year is divided into four equal quarters, and Q1 represents the very beginning of that cycle.

    For many organizations, Q1 is a foundational period. It is often when annual goals are set, budgets are finalized, and performance expectations are defined. Since it is the first quarter of the year, results from Q1 are closely watched to understand how well a company is starting the year and whether its strategies are on track.

    Example of a Calendar Year Company

    Consider a company that operates on a calendar year ending on December 31. For this company, Q1 includes all business activity that occurs between January 1 and March 31. Any revenue earned, expenses recorded, or performance metrics measured during this time are reported as part of the company’s Q1 results.

    This means that sales made in February, operating costs in January, and marketing performance in March are all grouped together when the company prepares its Q1 financial reports.

    Key Characteristics of Q1 in a Calendar Year

    • Q1 begins on January 1 and ends on March 31
    • It marks the start of a new financial and reporting year
    • Companies use Q1 data to evaluate early performance
    • Budget planning and forecasting often begin in this quarter
    • Q1 results help guide decisions for the remaining quarters

    Because Q1 sets the tone for the rest of the year, businesses often analyze this period carefully. Strong Q1 performance can signal healthy growth, while weaker results may prompt companies to adjust strategies early rather than waiting until later quarters.

    Q1 in a Fiscal Year

    Not all companies follow the calendar year when reporting their finances. Many businesses use a fiscal year, which starts and ends on dates that better align with their operations, industry cycles, or government regulations.
    When a company uses a fiscal year, the timing of Q1 changes, even though it still represents the first three months of that financial year.

    In a fiscal calendar, Q1 always begins on the first day of the fiscal year and ends three months later. The key difference is that this period may not fall between January and March. Instead, Q1 shifts based on when the company’s fiscal year officially starts.

    Example of a Fiscal Year Ending June 30

    If a company’s fiscal year ends on June 30, its new fiscal year begins on July 1. In this case, Q1 covers the period from July 1 to September 30. All financial activity during these months is reported as Q1 results, even though it occurs in the middle of the calendar year.

    For such companies, Q1 is still a planning and evaluation phase. Budgets are implemented, performance goals are reviewed, and early results are measured just as they would be in a calendar year structure.

    Common Fiscal Year Structures and Their Q1 Periods

    • Fiscal year starting January 1
    Q1 runs from January 1 to March 31

    • Fiscal year starting April 1
    Q1 runs from April 1 to June 30

    • Fiscal year starting July 1
    Q1 runs from July 1 to September 30

    • Fiscal year starting October 1
    Q1 runs from October 1 to December 31

    Understanding these variations is important when reviewing financial reports, comparing company performance, or analyzing earnings announcements. Two companies may both report Q1 results, but their reporting periods can be entirely different if they follow different fiscal calendars.

    This is why businesses, investors, and analysts always check whether Q1 refers to a calendar year or a fiscal year before making comparisons or decisions.

    Why Is Q1 Important in Business and Finance?

    Q1 plays a critical role in how businesses plan, measure, and communicate their financial performance. The first quarter of the year, it sets the foundation for decision-making throughout the remaining months. Many strategic and financial activities begin in Q1, making it one of the most closely analyzed periods in both business and finance.

    Financial Reporting

    Companies are required to report their financial performance on a quarterly basis, and Q1 is the first official checkpoint of the year. Q1 financial reports include revenue, expenses, profits, and other key metrics collected during the first three months.
    These reports help stakeholders understand how the company has started the year and whether it is moving in the right direction.

    Because Q1 data is the first set of results for the year, it often establishes expectations for future quarters. Analysts and decision makers use this information to identify early trends and potential challenges.

    Budgeting and Forecasting

    Q1 is closely tied to budgeting and forecasting activities. Many organizations finalize annual budgets at the start of the year and begin executing them during Q1. Actual performance in this quarter is compared against planned budgets to see whether spending and revenue targets are realistic.

    Forecasts for upcoming quarters are often adjusted based on Q1 results. If performance exceeds expectations, companies may revise growth targets upward. If results fall short, they may reassess spending, pricing, or operational strategies early in the year.

    Performance Tracking

    Tracking performance in Q1 helps businesses measure progress against their annual goals. Key performance indicators such as sales growth, customer acquisition, and operating efficiency are closely monitored during this period.

    Since Q1 marks the beginning of the year, it provides a clean baseline for comparison. Businesses can use Q1 data to track improvement or decline as the year progresses and make timely corrections rather than waiting until year-end.

    Investor Analysis

    Investors and financial analysts pay close attention to Q1 results because they offer early insight into a company’s financial health. Earnings reports released after Q1 often influence stock prices, investor confidence, and market expectations.

    Strong Q1 performance can signal effective planning and positive momentum, while weak results may raise concerns about execution or market conditions. Investors also compare Q1 performance year over year to evaluate long-term growth trends and stability.

    Q1 vs Other Quarters

    While Q1 is the first quarter of the year, it is only one part of a broader quarterly system used to track business and financial performance. Each quarter serves a different purpose, and understanding how Q1 compares with later quarters helps put results into proper context.

    Q1 vs Q2

    Q1 focuses on starting the year, setting goals, and measuring early progress, whereas Q2 builds on that foundation. After Q1 results are reviewed, many businesses refine their strategies and expectations for the rest of the year. This makes Q2 a period of execution and adjustment rather than initial planning.

    Q1 performance often answers the question of how the year has begun, while Q2 performance helps determine whether the company is maintaining momentum. To understand how the second quarter fits into this cycle, you can read our detailed guide on what does Q2 means, which explains how businesses evaluate growth after the first quarter.

    Q1 vs Q3

    By the time companies reach Q3, they already have data from both Q1 and Q2 to analyze trends. Q1 provides a baseline, while Q3 is typically used to assess whether annual targets are still achievable. Many organizations treat Q3 as a checkpoint before finalizing end of year strategies.

    Q1 is about direction and setup, whereas Q3 is about validation and preparation for closing the year strong. Businesses often compare Q3 results against Q1 to measure how much progress has been made over time. For a deeper explanation of the third quarter’s role, explore our article on what does Q3 mean, where we break down its importance in performance analysis.

    Why These Comparisons Matter

    Comparing Q1 with other quarters helps businesses, investors, and analysts avoid making decisions based on a single data point. A weak Q1 does not always indicate a poor year, just as a strong Q1 does not guarantee long-term success. Understanding how each quarter functions allows for more accurate planning, forecasting, and evaluation.

    Examples of Q1 Usage

    The term Q1 is commonly used in business, finance, and economic discussions to describe performance during the first quarter of the year. Below are some common ways Q1 appears in real-world contexts and what it typically means in each case.

    Q1 Financial Results

    When companies release their Q1 financial results, they are sharing a summary of how the business performed during the first three months of the year. These results usually include information about revenue, expenses, profits, and overall financial health.

    Q1 financial results help businesses and stakeholders understand whether the company is starting the year strong or facing early challenges. Since this is the first report of the year, it often sets expectations for future performance and guides planning for upcoming quarters.

    Q1 Earnings Report

    A Q1 earnings report is a detailed financial statement released by publicly traded companies after the first quarter ends. It typically includes income statements, balance sheets, and commentary from management about performance and outlook.

    Investors and analysts closely review Q1 earnings reports to evaluate how well a company is executing its strategy. These reports can influence investor confidence and market perception, especially when results differ from expectations.

    Q1 Sales Performance

    Q1 sales performance refers to the revenue generated from sales during the first quarter. Businesses analyze this data to understand customer demand, seasonal patterns, and the effectiveness of marketing and sales strategies.

    For many companies, Q1 sales performance is used as a benchmark for the rest of the year. Strong sales in Q1 may indicate healthy demand, while weaker results can prompt adjustments in pricing, promotions, or sales targets early in the year.

    Industries Where Q1 Matters Most

    Q1 does not affect every industry in the same way. While all businesses track quarterly performance, some industries place extra importance on Q1 because it strongly influences planning, revenue expectations, and decision-making for the rest of the year.

    Retail

    In the retail industry, Q1 is often used to evaluate performance after the holiday season. Sales data from January through March helps retailers understand post holiday demand, inventory movement, and customer buying patterns.

    Retailers also use Q1 to plan promotions, manage stock levels, and prepare for upcoming seasonal trends. Q1 results can reveal whether holiday strategies were effective and how consumer behavior is changing.

    Finance

    For banks, investment firms, and financial institutions, Q1 is critical for assessing market conditions and setting financial strategies. Q1 financial reports help determine profitability, risk exposure, and liquidity at the start of the year.

    Financial institutions also use Q1 data to adjust lending strategies, investment allocations, and growth forecasts based on early-year performance and economic indicators.

    SaaS

    Software as a Service companies rely heavily on Q1 data to measure subscription growth, customer retention, and recurring revenue. Because many SaaS businesses operate on annual contracts, Q1 often reflects renewals and new customer onboarding.

    Q1 performance helps SaaS companies evaluate product demand, pricing strategies, and customer engagement early in the year, allowing them to make data-driven improvements before scaling further and investing in marketing efforts such as SaaS link building.

    Manufacturing

    In manufacturing, Q1 is important for production planning and supply chain management. Manufacturers analyze Q1 demand to determine production volumes, staffing needs, and material sourcing.

    Q1 also helps identify potential bottlenecks or inefficiencies early in the year. This allows manufacturers to make adjustments before peak production periods later in the year.

    Tax and Accounting

    For tax professionals and accounting firms, Q1 is one of the busiest and most important periods of the year. It often involves preparing financial statements, managing compliance requirements, and assisting clients with planning and reporting.

    Q1 is also closely tied to quarterly tax obligations for businesses and self-employed individuals. Accurate Q1 records are essential for proper tax planning and avoiding financial surprises later in the year. Therefore, integrating wealth succession planning into your overall financial strategy can help ensure that your assets are aligned with your long-term goals and reduce potential legal complications.

    Frequently Asked Questions About Q1

    1. What does Q1 stand for?

    Q1 stands for Quarter 1, which is the first three months of a company’s financial or calendar year. It is commonly used in business, finance, and accounting to track performance, report results, and make strategic decisions.

    2. Is Q1 always January to March?

    Q1 is January to March only for companies that follow a calendar year. For businesses using a fiscal year, Q1 refers to the first three months of that fiscal year, which may start on a different date, such as July 1 or April 1. The concept of Q1 remains the same, even if the months differ.

    3. What is the difference between fiscal Q1 and calendar Q1?

    Calendar Q1 always runs from January 1 to March 31. Fiscal Q1 begins on the first day of a company’s fiscal year and ends three months later. The difference lies in the start and end dates, which depend on the organization’s financial calendar. Both are used to monitor performance, plan budgets, and report results.

    4. How long is Q1?

    Q1 is three months long in every case, whether it is part of a calendar year or a fiscal year. Each quarter in a year is equal in length, allowing companies to divide their financial year into four predictable periods for reporting and analysis.

    Conclusion

    Q1, or Quarter 1, is the first quarter of the year and serves as a key period for financial reporting, budgeting, performance tracking, and strategic planning. Whether a company follows a calendar year or a fiscal year, Q1 sets the foundation for the rest of the year. Understanding how Q1 works helps businesses, investors, and analysts make informed decisions and track progress accurately.

    For a complete picture of annual performance, it is also important to understand Q2 and Q3, which continue the financial cycle and allow businesses to adjust strategies based on earlier results. By learning how each quarter functions, you can better interpret business reports, track growth, and plan effectively throughout the year.

  • When Does Q2 End? Calendar Year vs Fiscal Year Explained Simply

    When Does Q2 End? Calendar Year vs Fiscal Year Explained Simply

    Q2 ends on June 30 for businesses and organizations that follow the standard calendar year. The second quarter runs from April 1 to June 30, making June 30 the official Q2 end date.

    People often search “when does Q2 end” because quarter timelines are crucial for financial reporting, budgeting, tax planning, payroll reviews, and performance analysis. Whether you’re a business owner, employee, investor, or student, knowing the exact Q2 end date helps you stay aligned with reporting deadlines and planning cycles.

    In this blog, we’ll clearly explain what Q2 means, when Q2 ends for both calendar and fiscal years, and why the Q2 end date matters for businesses and financial planning. We’ll also break down the differences between calendar and fiscal quarters, answer common questions about Q2 timelines, and provide a simple summary so you can quickly understand how Q2 applies to your situation.

    What Is Q2?

    Q2 stands for the Second Quarter of a year, which is a three-month period used in business, finance, and accounting to track performance and report results. A year is divided into four equal quarters, Q1, Q2, Q3, and Q4, each lasting three months.

    Meaning of Q2 (Second Quarter)

    Q2 represents the second three-month segment of a calendar or fiscal year.
    For companies that follow the calendar year, Q2 covers:

    • April
    • May
    • June

    The quarter officially ends on June 30 in a calendar year. Businesses use Q2 data to evaluate mid-year performance, adjust strategies, and prepare financial reports for stakeholders.

    Difference Between Quarters and Months

    While months divide a year into 12 individual time periods, quarters group three months together to make financial tracking and reporting more structured.

    • Months are commonly used for payroll, billing, and short-term planning
    • Quarters are used for earnings reports, tax planning, forecasting, and business reviews

    Using quarters like Q2 allows companies and analysts to compare performance consistently across different years, making trends and growth patterns easier to identify.

    When Does Q2 End in a Calendar Year?

    In a calendar year, Q2 follows the standard January–December timeline used by most businesses and organizations. Q2 ends on June 30, marking the completion of the second quarter of the year.

    Q2 Start and End Dates (Calendar Year)

    For companies that operate on a calendar year:

    • Q2 Start: April 1
    • Q2 End: June 30

    These dates are widely used for quarterly financial reporting, budget reviews, performance evaluations, and tax planning. Once Q2 ends on June 30, businesses transition into Q3 starting July 1.

    When Does Q2 End in a Fiscal Year?

    Unlike the calendar year, a fiscal year does not always run from January to December. Many companies and organizations choose a fiscal year that aligns better with their business cycle, revenue patterns, or tax planning needs. Because of this, the Q2 end date can vary.

    Fiscal Year vs Calendar Year

    • A calendar year runs from January 1 to December 31, with Q2 ending on June 30.
    • A fiscal year is a 12-month period chosen by a company or government body, which may start in any month of the year.

    Since quarters are based on the fiscal year start date, Q2 in a fiscal year always ends three months after it begins, but not necessarily in June.

    Example of Non-January Fiscal Years

    For example, if a company’s fiscal year:

    • Starts on July 1 and ends on June 30, then:
      • Q2 runs from October 1 to December 31
      • Q2 ends on December 31

    Many governments, educational institutions, and large corporations use non-January fiscal years to better align reporting with operational cycles.

    Calendar Year vs Fiscal Year Q2 

    While Q2 always represents the second quarter of a year, its start and end dates change depending on whether a business follows a calendar year or a fiscal year. The table below highlights the key differences.

    BasisCalendar Year Q2Fiscal Year Q2
    Start DateApril 1Varies based on fiscal year start
    End DateJune 30Varies (three months after Q2 begins)
    Common UsersMost businesses, small companies, individualsGovernments, large corporations, educational institutions

    This distinction is important because financial reporting, budgeting, and tax deadlines are all tied to the type of year a business follows.

    Why Knowing When Q2 Ends Is Important

    Knowing when Q2 ends is essential for businesses, professionals, and even individuals because many critical financial and strategic decisions depend on quarter-end timelines. The Q2 end date acts as a checkpoint for reviewing progress, meeting obligations, and planning ahead.

    Financial Reporting

    The end of Q2 signals the close of the first half of the year, making it one of the most important reporting periods. Companies use Q2 data to prepare income statements, balance sheets, and cash flow reports that reflect mid-year performance. Investors and stakeholders closely review these reports to assess profitability, financial stability, and growth potential. Accurate Q2 reporting also ensures consistency in year-over-year comparisons, which is crucial for long-term analysis.

    Business Planning and Budgeting

    Q2 ending provides businesses with a clear opportunity to reassess budgets and forecasts. By this stage, companies have enough data to determine whether they are meeting annual targets or falling behind. If expenses are higher than expected or revenues are lower, corrective actions, such as reallocating budgets, adjusting pricing, or revising sales strategies, can be implemented before the second half of the year begins.

    Tax Deadlines and Compliance

    Many tax obligations are structured around quarterly timelines. For freelancers, small business owners, and corporations, the end of Q2 often aligns with quarterly estimated tax payments and regulatory filings. Knowing the exact Q2 end date helps ensure taxes are calculated correctly for the quarter and submitted on time, reducing the risk of penalties, interest charges, or compliance issues.

    Performance Analysis

    Q2 results are widely used for performance evaluation because they offer a broader view than a single quarter while still allowing timely adjustments. Businesses compare Q2 data with Q1 and previous years’ Q2 performance to identify trends, seasonal impacts, and operational strengths or weaknesses. This analysis supports smarter decision-making and helps leadership teams set realistic goals for Q3 and Q4.

    Common Questions About Q2 End Date 

    Q1. When does Q2 end for most companies?

    For most companies that follow the calendar year, Q2 ends on June 30. These businesses operate on a January–December timeline, making Q2 run from April 1 to June 30. This structure is commonly used for financial reporting, budgeting, and performance tracking.

    Q2. Can Q2 end on a different date?

    Yes, Q2 can end on a different date if a company follows a fiscal year instead of a calendar year. Since fiscal years can start in any month, the Q2 end date depends on when the fiscal year begins. In these cases, Q2 still lasts three months but may end in months other than June.

    Q3. Is Q2 always April to June?

    No, Q2 is not always April to June. While this applies to calendar-year businesses, companies with non-January fiscal years may have Q2 fall in entirely different months. The key rule is that Q2 is always the second three-month period of a company’s year, regardless of the actual months involved.

    Final Summary: When Does Q2 End?

    To summarize, when does Q2 end depends on the type of year a business follows. For most companies using the calendar year, Q2 ends on June 30, covering the period from April 1 to June 30. However, for organizations that operate on a fiscal year, the Q2 end date can vary based on when their fiscal year begins.

    Understanding when Q2 ends is important for accurate financial reporting, effective business planning, timely tax compliance, and meaningful performance analysis. Knowing the correct Q2 end date helps ensure decisions and deadlines stay aligned throughout the year.

  • What is MOQ: Meaning, Definition & Impacts Explained

    What is MOQ: Meaning, Definition & Impacts Explained

    When dealing with suppliers, manufacturers, or wholesalers, one term comes up again and again: MOQ. If you have ever been told that you must order a certain number of units before a supplier will accept your order, you have already encountered it in action. MOQ plays a major role in pricing, inventory planning, cash flow, and even supplier relationships.

    In simple terms, MOQ determines the smallest quantity of a product you can order at one time. But its impact goes far beyond that single definition. It affects how businesses buy, sell, store, and scale.

    In this guide, we will explain the meaning of MOQ, its definition, how it works, why suppliers use it, and the real business impacts you should understand before placing your next order.

    What is MOQ?

    MOQ stands for Minimum Order Quantity. It is the minimum number of units or the minimum order value a supplier is willing to sell in a single order.

    For example, if a supplier sets an MOQ of 500 units, you must order at least 500 pieces of that product. Some suppliers define MOQ by quantity, while others define it by order value, such as $1,000 per order.

    MOQ is widely used in manufacturing, wholesale, ecommerce, dropshipping, and international trade. It helps suppliers cover production costs and helps buyers plan inventory more efficiently.

    MOQ Meaning in Simple Words

    MOQ

    The meaning of MOQ is straightforward: the smallest amount you are allowed to buy from a supplier at one time.

    Think of it like a store rule. Just as some stores only sell products in packs, suppliers use MOQ to ensure their business operations remain profitable and efficient.

    For small businesses, startups, and online sellers, MOQ often becomes one of the first challenges when sourcing products.

    MOQ Definition

    From a business perspective, MOQ can be defined as:

    The minimum quantity of goods or minimum order value that a supplier requires a buyer to purchase in a single transaction.

    This definition applies whether you are working with local wholesalers, overseas manufacturers, or B2B ecommerce platforms like Alibaba.

    Why Do Suppliers Set MOQ?

    Suppliers do not choose MOQ randomly. There are several practical reasons behind it.

    First, manufacturing products has fixed costs. Machines must be set up, raw materials must be prepared, and workers must be paid. Producing very small quantities often costs nearly the same as producing larger batches.

    Second, packaging, labeling, and shipping also involve expenses. Handling small orders repeatedly can be inefficient and time-consuming for suppliers.

    Third, suppliers want to ensure profitability. Selling low quantities at wholesale prices may not cover their operational costs.

    Finally, MOQ helps suppliers manage their workflow and inventory. It allows them to plan production schedules more accurately and avoid frequent small interruptions.

    Types of MOQ

    MOQ can appear in different forms depending on the supplier and industry.

    1. Quantity-Based MOQ

    This is the most common type. The supplier specifies the number of units you must order, such as 100 pieces or 1,000 units.

    2. Value-Based MOQ

    Instead of units, the supplier sets a minimum order value, such as $500 or $2,000 per order.

    3. SKU-Based MOQ

    Some suppliers require a minimum quantity for each product variant, such as each color or size.

    4. Production MOQ

    Manufacturers may require a minimum batch size to start production, especially for customized products.

    How MOQ Works in Real Business Scenarios

    Imagine you run an online store selling phone accessories. You find a supplier offering phone cases at a great price, but the MOQ is 1,000 units.

    If you only sell 100 cases per month, ordering 1,000 units means you will hold inventory for 10 months. This affects your cash flow, storage costs, and risk of unsold stock.

    On the other hand, if you are a wholesaler or a fast-growing ecommerce brand, a large MOQ might help you secure better pricing and increase profit margins.

    This is why understanding MOQ is critical before choosing a supplier.

    Impacts of MOQ on Businesses

    MOQ has both positive and negative effects depending on your business size and strategy.

    A. Impact on Cash Flow

    High MOQ often requires a large upfront investment. For small businesses, this can strain cash flow and limit the ability to invest in marketing, staff, or new products.

    Low MOQ, on the other hand, allows businesses to test products with minimal financial risk.

    B. Impact on Inventory Management

    Large MOQs can result in overstocking. Excess inventory takes up warehouse space and increases storage costs. It also increases the risk of damage, obsolescence, or changes in customer demand.

    Smaller MOQs make inventory management more flexible and reduce waste.

    C. Impact on Pricing and Profit Margins

    Suppliers usually offer lower prices for higher order quantities. This means higher MOQs often lead to better unit costs and improved profit margins.

    Lower MOQs may come with higher per-unit prices, reducing short-term profitability.

    D. Impact on Supplier Relationships

    Meeting or exceeding MOQ can strengthen relationships with suppliers. It signals commitment and reliability, which may lead to better payment terms, priority production, and exclusive deals.

    Failing to meet MOQ can limit your supplier options.

    5. Impact on Product Testing and Market Entry

    Startups and new ecommerce sellers often struggle with MOQ when launching new products. High MOQs increase the risk of product failure.

    Low MOQ suppliers allow businesses to test market demand before scaling production.

    MOQ in Different Industries

    MOQ is used across many industries, but its importance varies.

    1. Manufacturing

    In manufacturing, MOQ is often strict because production setup costs are high. Customized products usually have higher MOQs.

    2. Wholesale and Distribution

    Wholesalers use MOQ to ensure bulk purchases and efficient logistics.

    3. Ecommerce and Dropshipping

    Many ecommerce sellers prefer low MOQ suppliers to reduce risk and storage needs. Dropshipping businesses often look for suppliers with no MOQ.

    4. Retail

    Retailers use MOQ when ordering stock from distributors or manufacturers to maintain consistent inventory levels.

    How to Calculate the Right MOQ for Your Business

    Understanding your ideal MOQ is just as important as understanding your supplier’s MOQ.

    Start by analyzing your average monthly sales. Then calculate how long it will take to sell a bulk order. Next, consider your storage capacity and holding costs. Factor in your cash flow and available working capital.

    Finally, compare supplier pricing at different quantity levels. Sometimes ordering slightly more can significantly reduce per-unit cost and increase profit.

    How to Negotiate MOQ with Suppliers

    MOQ is not always fixed. Many suppliers are open to negotiation, especially if you approach them professionally.

    You can start by explaining that you are a new buyer and want to test product quality and demand.

    Offering to pay a higher price per unit for a lower MOQ is another common strategy. You can also ask for a trial order or sample batch before committing to a large purchase.

    Building a long-term relationship often leads to more flexible MOQs in the future.

    MOQ and Inventory Management

    MOQ has a direct and long-term impact on how businesses manage their inventory. The minimum quantity you are required to order often determines how much stock you keep on hand, how often you reorder, and how much capital is locked in unsold products.

    When MOQ is high, businesses are forced to purchase large quantities at once. This usually increases inventory levels, warehouse space requirements, and storage costs. It can also lead to slow-moving stock, especially if demand changes or sales are lower than expected. In such cases, businesses may need to offer discounts or run promotions just to clear excess inventory.

    On the other hand, a low MOQ gives businesses greater flexibility. It allows more frequent reordering, smaller stock levels, and better alignment between supply and actual customer demand. This is especially helpful for ecommerce stores, seasonal businesses, and startups testing new products.

    Advantages of MOQ

    MOQ is not only beneficial for suppliers. Buyers also gain advantages.

    -It encourages bulk purchasing, which reduces per-unit cost.

    -It improves supply chain efficiency and consistency.

    -It helps businesses plan inventory more systematically.

    -It strengthens long-term supplier partnerships.

    Disadvantages of MOQ

    However, MOQ also has downsides.

    • It can create high entry barriers for startups.
    • It increases inventory risk.
    • It ties up working capital.
    • It limits flexibility when testing new products.

    MOQ vs EOQ: Key Differences Explained

    Below is a clear comparison table you can add to your article.

    FeatureMOQ (Minimum Order Quantity)EOQ (Economic Order Quantity)
    MeaningThe minimum quantity a supplier requires per orderThe ideal quantity a business should order to minimize total inventory cost
    Set bySupplier or manufacturerBuyer or business
    Main purposeEnsure supplier profitability and efficient productionReduce storage, ordering, and holding costs
    FocusSupplier constraintsBusiness optimization
    FlexibilityUsually fixed, but sometimes negotiableCalculated based on demand, costs, and storage capacity
    Impact on pricingHigher MOQ often lowers unit priceOptimizes total cost rather than unit price
    Impact on inventoryCan increase inventory levels if set highAims to maintain balanced inventory levels
    Used inManufacturing, wholesale, procurementInventory planning and supply chain management
    Risk factorMay cause overstocking or cash flow issuesHelps avoid overstocking and stockouts

    How to Reduce the Risks of High MOQ

    If you must work with high MOQ suppliers, there are ways to reduce risk.

    -You can bundle products to increase sales volume.

    -You can run promotions to move inventory faster.

    -You can share orders with other businesses.

    -You can negotiate staggered deliveries.

    -You can improve demand forecasting using sales data.

    Future Trends in MOQ

    As ecommerce grows and supply chains become more digital, many suppliers are offering more flexible MOQs.

    Print-on-demand, dropshipping, and small-batch manufacturing are reducing barriers for startups. However, traditional manufacturing industries still rely heavily on MOQ to maintain efficiency.

    In the coming years, technology and automation are likely to lower production costs, making smaller MOQs more common.

    Final Thoughts

    MOQ, or Minimum Order Quantity, is a fundamental concept in supply chain and business operations. It influences how much you spend, how much you store, how you price your products, and how you scale your business.

    Understanding the meaning, definition, and impacts of MOQ allows you to make smarter purchasing decisions and avoid costly mistakes. Whether you are a startup founder, ecommerce seller, wholesaler, or procurement manager, learning how to manage MOQ effectively can significantly improve your profitability and operational efficiency.

    By choosing the right suppliers, negotiating wisely, and planning inventory carefully, MOQ can become a strategic advantage instead of a limitation.

    FAQs 

    1. What is a good MOQ for small businesses?

    A good MOQ for small businesses is usually between 50 and 300 units, depending on the product price and demand. Lower MOQs help reduce financial risk and make inventory easier to manage, especially for startups and ecommerce sellers.

    2. Can MOQ be negotiated with suppliers?

    Yes, MOQ is often negotiable. Many suppliers are willing to reduce it for first-time buyers, trial orders, or long-term partnerships. You can also offer to pay a slightly higher unit price in exchange for a lower MOQ.

    3. Is MOQ the same as minimum order value?

    Not always. MOQ usually refers to the minimum number of units, while minimum order value refers to the minimum total cost of an order. Some suppliers use one, and others use both.

    4. How does MOQ affect product pricing?

    Higher MOQs usually result in lower per-unit costs because suppliers benefit from bulk production. Lower MOQs often come with higher prices per unit since production and handling costs are spread across fewer items.

    5. What happens if I don’t meet the MOQ?

    If you don’t meet the MOQ, the supplier may refuse to process your order, charge a higher price, or ask you to increase your order quantity. In some cases, they may offer alternatives such as mixed SKUs or trial orders.

  • What Is a Planogram and Why It’s Essential for Retail Merchandising

    What Is a Planogram and Why It’s Essential for Retail Merchandising

    Walk into any successful retail store and you will notice something immediately. The shelves look neat, products are easy to locate, and popular items seem to appear exactly where your eyes naturally fall. Promotional products catch attention without making the store feel cluttered. This is not a coincidence. Behind this organized experience is a powerful retail planning tool known as a planogram.

    A planogram helps retailers decide where each product should be placed, how much space it should receive, and how shelves should be arranged to increase visibility and sales. In today’s competitive retail environment, this kind of planning is no longer optional. It is essential for improving store layout, customer satisfaction, and overall profitability.

    This guide explains what a planogram is, how it works, and why it plays such an important role in modern visual and retail merchandising.

    What Is a Planogram?

     mannequin

    A planogram is a visual layout or diagram that shows how products should be displayed on shelves, racks, or other store fixtures. It works like a blueprint for retail shelving and product placement.
    Instead of relying on guesswork, retailers use planograms to make structured decisions about where items should go. These decisions include which products belong on specific shelves, how many units of each product should be shown, which items deserve eye-level placement, and where promotional products should appear.

    Planograms can be created using simple drawings or spreadsheets, but most retailers today rely on specialized planogram software. Digital tools make it easier to update layouts, adjust for new products, and share instructions with store staff across different locations.

    Why Planograms Are Important in Retail Merchandising

    Retail merchandising is all about how products are presented to customers. The way items are arranged strongly influences what people notice, what they pick up, and what they eventually buy.

    Without a structured plan, shelves often become inconsistent. Some areas may be overcrowded, while others look empty. Popular products may be hidden, and slow-moving items may take up valuable space.

    Planograms bring order and strategy into this process. They help retailers replace random placement with data-driven decisions. When merchandising is planned carefully, stores look more professional, customers feel more comfortable shopping, and sales naturally increase.

    How Planograms Improve Product Visibility

    Product visibility plays a major role in purchasing decisions. Customers cannot buy what they cannot see.

    Planograms help retailers place high-demand and high-profit items where they are most likely to be noticed. Products that perform well are often positioned at eye level, while promotional items are placed in areas where customers naturally pause, such as aisle ends or near checkout counters.

    New arrivals also benefit from structured placement. Instead of being buried among older stock, they receive dedicated space that encourages customers to explore them.
    When products are displayed clearly and logically, customers spend less time searching and more time making buying decisions. This simple improvement can significantly increase conversion rates and basket size.

    Making Better Use of Shelf Space

    departmental store shelves

    Shelf space is limited, especially in small and medium-sized stores. Every section of a shelf has value.

    Planograms help retailers allocate this space wisely by analyzing sales performance and customer demand. Products that sell quickly receive more space, while items that move slowly are reduced or relocated.

    This balance prevents overcrowding, which can make shelves look messy, and it also avoids empty gaps that make a store appear poorly managed. A well-planned shelf looks full without feeling cluttered, which improves both visual appeal and operational efficiency.

    Better space management also supports inventory control. Retailers can avoid overstocking low-demand items and reduce storage costs by displaying only what is needed.

    Improving the Customer Shopping Experience

    Modern customers expect convenience. They want to walk into a store, find what they need quickly, and leave feeling satisfied. Disorganized shelves create frustration. Shoppers may walk away if they cannot locate products easily or if the store feels chaotic.

    Planograms help solve this problem by creating logical product groupings and consistent layouts. When similar items are placed together and categories are clearly structured, customers can move through the store naturally without confusion.

    A smoother shopping experience encourages people to stay longer, explore more products, and return in the future. Over time, this builds trust and brand loyalty.

    Supporting Brand Guidelines and Supplier Agreements

    Retailers often work closely with brands and suppliers who request specific product placement. These agreements may require certain products to appear at a specific height, in a particular section, or with a minimum number of visible units.
    Manually managing these requirements across multiple stores can be difficult. Planograms simplify this process by clearly showing where each brand’s products should be displayed.

    By following planogram guidelines, retailers protect important business relationships and ensure compliance with merchandising contracts. This can also lead to better supplier support, exclusive deals, and additional promotional opportunities.

    Different Types of Planograms

    Retailers use different types of planograms depending on their goals.

    • Product-Based Planograms

    These focus on individual products or brands.

    They are common in electronics, cosmetics, and packaged goods.

    • Category-Based Planograms

    Products are grouped into categories like beverages, snacks, or personal care.

    This makes shopping easier for customers.

    • Sales-Driven Planograms

    These prioritize high-performing products.

    Best sellers receive better placement and more shelf space.

    • Seasonal Planograms

    Used during festivals, holidays, or seasonal campaigns.

    Examples include Diwali sales, Christmas displays, or back-to-school promotions.

    • Promotional Planograms

    Created for discounts, product launches, or limited-time offers.

    How Planograms Are Created

    Creating an effective planogram requires careful planning and reliable data. The process usually begins with analyzing sales reports to understand which products perform well and which do not. Retailers study customer preferences, buying patterns, and seasonal trends to guide their decisions.

    Next, the physical store layout is evaluated. Shelf dimensions, aisle width, lighting, and customer movement patterns are all considered. Areas with heavy foot traffic are often reserved for high-value or promotional items.

    Products are then grouped logically so that related items appear together. Complementary products may be placed nearby to encourage cross-selling.

    Once placement decisions are made, the layout is designed visually using planogram software or diagrams. The final version is shared with store employees, who follow it while stocking shelves. Regular updates are important, especially when new products are introduced or sales trends change.

    The Role of Planogram Software in Modern Retail

    Technology has transformed how retailers manage shelf layouts.

    Modern planogram software allows teams to design store layouts visually, calculate shelf space automatically, and integrate inventory data in real time. These tools reduce manual errors and make it easier to adjust layouts quickly.

    For large retail chains, software also helps maintain consistency across locations. A single planogram can be shared with hundreds of stores, ensuring that customers see the same layout wherever they shop.

    Software solutions also allow retailers to measure the performance of different layouts, helping them test and refine merchandising strategies over time.

    Benefits of Using Planograms

    One of the most obvious benefits of planograms is increased sales. Better visibility and logical placement naturally encourage customers to buy more.

    Planograms also improve inventory management by reducing overstocking and stockouts. Retailers gain better control over how much product is displayed and when it should be replenished.

    Store operations become more efficient as well. Employees spend less time deciding where products belong, which reduces training time and speeds up restocking.

    Consistency across stores strengthens brand image, while data-driven planning leads to smarter business decisions. Together, these advantages make planograms a powerful tool for both short-term performance and long-term growth.

    Common Mistakes to Avoid When Using Planograms

    Despite their benefits, planograms are not foolproof.

    1. Some retailers rely on outdated sales data, which leads to poor placement decisions. Others overcrowd shelves, making products harder to see rather than easier.

    2. gnoring customer behavior is another common mistake. A layout that looks good on paper may not match how shoppers actually move through a store.

    3. Lack of staff training can also cause problems. If employees do not understand the importance of following the planogram, layouts quickly become inconsistent.

    4. Finally, failing to update planograms regularly can reduce their effectiveness, especially in fast-changing retail environments.

    Planograms for Small Retail Stores

    Small retailers often believe that planograms are only for large chains, but this is not true.

    In fact, limited space makes planning even more important for small shops. A well-designed planogram helps small businesses look organized, professional, and easy to shop in.

    It also reduces waste by ensuring that only relevant products take up valuable shelf space. Even simple tools like spreadsheets or basic design software can help small retailers create effective layouts.

    Planograms for Large Retail Chains

    Large retailers operate across multiple locations, sometimes in different regions or countries. Maintaining consistency in such environments is difficult without structured planning.

    Planograms allow central teams to control store layouts, ensure brand standards, and manage inventory distribution efficiently.

    They also support negotiations with suppliers by clearly defining how products will be displayed in every store.

    Planograms and Visual Merchandising

    Planograms provide structure, but visual merchandising adds creativity. Together, they form the foundation of effective retail presentation.

    While planograms decide where products go, visual merchandising focuses on how they look. Lighting, signage, colors, and display themes all work alongside structured placement to attract attention and guide customer movement.

    Stores that balance both strategy and creativity tend to perform better and leave stronger impressions on customers.

    Real-World Impact of Planograms

    Consider a grocery store that sells dozens of snack brands.

    Without a planogram, products are scattered across shelves. Some popular brands sell out quickly, while others gather dust. Customers struggle to compare options or find their favorites.

    When a planogram is introduced, the layout becomes organized. Best-selling brands receive more space, similar products are grouped together, and promotional items are clearly highlighted.

    Customers shop more confidently, and sales increase without changing product prices. This is the practical value of structured shelf planning.

    The Future of Planograms in Retail

    Retail is evolving rapidly, and planograms are evolving with it.

    Artificial intelligence is being used to predict demand and optimize layouts automatically. Smart shelves can track stock levels in real time and notify staff when items run low.

    Retailers are beginning to personalize layouts based on customer behavior and local preferences.

    In the future, planograms will not just guide shelves. They will become intelligent systems that adapt continuously to changing conditions.

    Best Practices for Planogram Success

    Successful retailers treat planograms as living documents rather than one-time projects.

    They update layouts regularly, train employees carefully, and monitor sales data to refine their strategies.

    They also test different arrangements to see what performs best and adjust based on real customer behavior.

    Most importantly, they keep the customer experience at the center of every decision.

    Final Thoughts

    A planogram is far more than a simple shelf diagram. It is a strategic tool that shapes how customers interact with products, how efficiently stores operate, and how profitable a retail business becomes.

    In a world where competition is intense and customer expectations are high, relying on instinct alone is no longer enough. Data-driven merchandising is the future, and planograms make it possible.

    Whether you run a small neighborhood shop or manage a large retail chain, implementing effective planograms can transform your store’s performance.

    They help customers shop more easily. They help staff work more efficiently. And most importantly, they help your business grow.

  • Design.com: Is It the Best Logo Maker Tool for your business?

    Design.com: Is It the Best Logo Maker Tool for your business?

    Logo maker tools give small businesses and entrepreneurs an easier and more accessible way to create a logo, without having to spend big bucks on designers or learning Photoshop from scratch. You just need to select a premade template, customize a few things, and boom a beautiful logo right at your fingertips. 

    That’s why logo makers have been massively popular over the last few years. You’ve probably even seen slogans such as “Get the logo of your dreams in seconds” all over the internet. 

    It all sounds great, but which of the hundred logo maker tools is actually worth it? 

    Design.com is one of the bigger players, offering over 360,000 templates made by professional designers. From tech startups to food brands, its library covers a wide range of styles. So is it the best logo maker tool? We put it to the test, diving into its features, plus see how it works across different industries. See it all below!

    What is Design.com’s Logo Maker?

    Design.com is an online branding platform that offers customizable templates for branding and marketing assets such as websites, business cards, email signatures, social media graphics, flyers, presentations, and more. However, their main offering is their logo maker tool, which they describe as the best logo maker in the world. 

    Reviews and rating does indeed back it up. They have a high 4.7 Trustpilot rating across thousands of reviews. This shows strong social proof. They also have the world’s largest template library at 360,000 templates, the biggest among competitors. These templates span across multiple industries, such as construction, hospitality, food, skincare, gaming, and more. 

    All logos you see on Design.com are also: 

    • Created by professional designers
    • Uses exclusive fonts and icons (rather than stock fonts or graphics) for a more unique and original look
    • Rigorously reviewed for originality and commercial safety
    • Undergoes a checking and approval process to ensure only the best logos are on the platform
    • Can be fully edited and customized to suit your vision and preference
    • Uses a beginner-friendly, drag and drop editor for easy tweaking (no need for technical editing knowledge)
    • Can be downloaded in multiple hi-res formats such as PNG, JPG, SVG, EPS, PDF, GIF, MP4
    • Only available in the platform
    • Logo style, color palette, and typography can be automatically applied to websites, social media graphics, and more to form a cohesive look across materials

    How the Logo Maker Works

    The process is simple. To get started:

    1. Go to https://www.design.com/logo-maker. Enter your business name. You can also choose from their categories, such as “minimalist”, “tree”, or “fitness”. 
    1. Browse through the results. You can shortlist the ones you like by clicking the heart icon. You can also further refine your search by filtering by logo style or color.
    1. Choose a design you like best. You can go through the guided editor or just manually do all the changes on your own. And even if you go through the guided one and want to change something, don’t worry as you can still edit it after. 
    1. If you want to manually edit, you can change everything from the icon, color, layout, font, and more. You can also add preset animations if you want a dynamic logo.
    1. Happy with how it looks? Click Download to get your logo. You can also Save Progress if you want to just get back to it later, or preview how your logo will look across different platforms first before downloading it. After downloading, you can use a link shortener to share your logo quickly and track engagement across social media, emails, or marketing channels. 

    How the Logos Look Across Different Industries

    To get a better sense of range, we investigated how Design.com performs in different categories.

    Tech and SaaS logos tend to be clean and restrained, nothing flashy. You can see tons of simple geometrical shapes, abstract style icons, and modern fonts. These work well for businesses that want to look credible without overdesigning.

    Food and beverage logos are more expressive. Warmer colors, fun illustrations, and friendlier typography show up more often. They feel appropriate for menus, packaging, and storefronts.

    Wellness and skincare logos are more flowy. They also feature leaves, flowers, chakra symbols, and such. Color schemes lean toward cool pastels and muted tones to look more relaxing and serene. 

    Across all three, the common thread is balance. Logos don’t feel cluttered or awkwardly composed. They also fit “industry standards” – meaning they use color schemes, fonts, and other visual elements that are typically appropriate for the intended industry. 

    Pros of Using Design.com Logo Maker

    There’s multiple reasons why the platform has built a strong reputation in the market.

    • The logo library is massive so users have thousands of options to choose from.
    • The templates vary in style and type, so you can choose between a minimalist abstract icon to an ornate crest-style badge logo, down to a fun doodle-y style handwriting wordmark.
    • Over 575+ fonts and 62,000 custom icons available which helps make the design look unique and distinctive, and not cookie-cutter.
    • Logos are created by top designers, so every logo looks professional and high-quality. Nothing looks like placeholders or stock logos. 
    • Designs are exclusive and not recycled across platforms.
    • Editing is easy without being limiting.
    • File formats cover pretty much every use case.
    • Logos are commercially safe, which is important for business use.
    • Option to get exclusive licensing for your logo.
    • Reviews say that the customer support is top notch and available 24/7.
    • Option to use AI logo generator for an even faster process, as the AI can generate thousands of designs in seconds.

    Cons of Design.com Logo Maker

    Design.com is great but there are still a few things to keep in mind. 

    • The tool is web-based and has no app yet. This might be limiting for some users who prefer having a separate app or editing on mobile. 
    • While there are free logos available, the premium logos can only be downloaded under a subscription. The price is still more affordable compared to hiring a designer, but it’s still worth mentioning it for consideration. 

    Pricing of Design.com

    How much does a logo on Design.com cost? Here is the breakdown:

    • Free Plan: $0. Users can browse and edit all logos for free. You can also download a free logo to use, no watermarks or hidden charges. 
    • Saver Plan: $15/month (Logo Pack only)
    • Value Plan: $24/month (Logo + Website)
    • Premium Plan: $29/month (Logo + Website + more features)

    Here are some further explanations if you need more clarification: 

    There are free logos and premium logos on Design.com. Free logos are free to download, again with no watermarks or any hidden fees. 

    Premium logos can be edited for free. But if you want to download it for use you’ll have to subscribe to any of the plans listed above. 

    You can see which logos are free and premium by looking at the top left corner, as they are marked as such. 

    If you want to know the inclusions in Design.com’s plan, here is the list of what is included in all plans:

    • Your logo is yours forever
    • Cancel anytime
    • High-res and vector logo files
    • Unlimited changes to your logo
    • Business cards
    • Instagram and Facebook posts
    • Email signature templates
    • Letterheads
    • 50+ other design tools
    • 564,000+ templates

    Then these are the additional features included in the Premium Plan: 

    • Website builder
    • Link in bio tool
    • Digital business card

    Final Thoughts: 

    So is Design.com the best logo maker tool? Our verdict is yes. 

    Design.com delivers one of the most seamless, convenient, and design-focused logo maker experiences available today. Its strength lies in the sheer depth of professionally designed templates, which allows users from any industry or niche to find a logo that is perfect for them. Users can even be as picky as they want, as there are thousands to choose from! 

    The tool is also made with beginners and non-designers in mind. It uses a simple interface and straightforward controls, which allow anyone to easily tweak a design and achieve great results.

    So if you’re a startup, small business, or entrepreneur who wants a logo that looks credible and ready for launch, then hop on to Design.com now. 

  • Why SEO for Business Is No Longer Optional in 2026

    Why SEO for Business Is No Longer Optional in 2026

    A decade ago, businesses could still grow through word of mouth, social media, or paid ads alone. Today, that reality has changed. In 2026, when someone needs a product, service, or solution, the first instinct is to search online or ask an AI assistant. If your business does not appear in those results, you effectively do not exist to a large portion of your potential customers.

    SEO, or Search Engine Optimization, is no longer a “nice-to-have” marketing tactic. It is now a fundamental business requirement. From startups to global enterprises, SEO plays a direct role in visibility, credibility, customer acquisition, and long-term growth.

    This article explains why SEO for business is essential in 2026, how consumer behavior has evolved, what benefits SEO offers today, and how companies can use it to stay competitive in a rapidly changing digital world.

    The Way Customers Find Businesses Has Changed Forever

    Modern customers rarely rely on phone directories, printed ads, or physical referrals alone. They search online for almost everything.

    They search when they want to buy something.
    They search when they want to compare options.
    They search when they want reviews.
    They search when they want solutions to problems.

    Whether it is “best accounting software for small businesses,” “digital marketing agency near me,” or “affordable CRM tools,” search engines and AI platforms are the first stop.

    If your business does not appear on the first page, most users will never see you. Studies consistently show that the majority of clicks go to the top five results. Being invisible in search is the same as being invisible in the market.

    SEO Is Now a Core Business Investment, Not Just Marketing

    person discussing seo

    In earlier years, SEO was often treated as a technical add-on handled by marketing teams. In 2026, it has become a strategic investment that directly impacts revenue.

    SEO influences how customers discover your brand, how trustworthy your business appears, and how easily people can access your products or services. It also affects how AI systems interpret and recommend your business.

    Unlike paid advertising, SEO continues to generate results long after the initial work is done. A well-optimized website can bring consistent traffic for years, making SEO one of the highest return-on-investment channels available to businesses today.

    The Rise of AI Search Makes SEO Even More Important

    Search is no longer limited to Google results pages.

    Millions of users now rely on AI tools such as ChatGPT, Bing AI, Claude AI users, voice assistants, and generative search experiences to ask questions like:

    “What is the best project management software for startups?”
    “Which SEO company is reliable for small businesses?”
    “How can I grow my business online?”

    These platforms pull information from high-quality, optimized websites. Businesses with strong SEO foundations are far more likely to be mentioned, summarized, or recommended.

    Without SEO, your content may never reach these AI systems in a meaningful way.

    SEO Builds Trust Before Customers Ever Contact You

    In 2026, customers are more cautious than ever. They research before buying.

    When your business consistently appears in top search results, users subconsciously associate your brand with credibility and authority. Ranking well signals that your business is established, relevant, and reliable.

    On the other hand, if your website is hard to find or poorly optimized, users may assume your business is outdated or untrustworthy, even if your products are excellent.

    SEO helps create a strong first impression long before any sales conversation begins.

    The Role of SEO Tools in Modern Business Growth

    person doing seo analysis

    SEO is no longer a manual or intuition-based activity. Search engines use hundreds of ranking signals, user behavior changes rapidly, and competitors constantly refine their strategies. Managing all of this without the right tools is nearly impossible. SEO tools help businesses monitor performance, discover opportunities, fix technical issues, track competitors, and measure real business impact. They turn SEO into a structured, data-driven process instead of trial and error.

    These tools help businesses answer critical questions such as: Which keywords bring high-quality leads? Why did rankings drop last month? Which pages convert best? What content gaps exist in the market? How does our website compare to competitors? By providing accurate, real-time data, SEO tools allow companies to optimize continuously, reduce wasted effort, and focus on strategies that generate revenue.

    SEO tools like Ahrefs Brand Radar also play a major role in AI-driven search visibility. Well-structured data, clean technical setups, and optimized content make it easier for AI systems and voice assistants to understand and recommend a business. As AI search grows, tools that track structured data, featured snippets, and conversational keywords are becoming essential.

    Below are some of the most important SEO tools businesses rely on:

    Google Search Console

    • Shows how your website appears in Google search results.
    • Identifies indexing issues, crawl errors, and mobile usability problems.
    • Reveals which queries bring traffic and which pages perform best.
    • Helps submit new pages for faster indexing.

    Google Analytics (GA4)

    • Tracks visitor behavior, traffic sources, and conversion paths.
    • Shows how users move through your website and where they drop off.
    • Helps measure ROI from SEO by connecting traffic with sales or leads.
    • Supports data-driven improvements to content and user experience.

    Ahrefs

    • One of the most powerful tools for backlink analysis and competitor research.
    • Helps identify which websites link to competitors but not to you.
    • Finds high-value keywords and content ideas based on search demand.
    • Tracks keyword rankings over time.

    SEMrush

    • An all-in-one platform for keyword research, technical audits, and competitor tracking.
    • Provides detailed site health reports and SEO recommendations.
    • Helps analyze paid ads and organic strategies used by competitors.
    • Supports content optimization and topic research.

    Ubersuggest

    • Beginner-friendly keyword research and content planning tool.
    • Shows keyword difficulty, search volume, and ranking opportunities.
    • Useful for small businesses with limited SEO budgets.
    • Helps discover long-tail keywords with high intent.

    Screaming Frog SEO Spider

    • Technical SEO auditing tool used to scan entire websites.
    • Finds broken links, duplicate content, missing meta tags, and redirect issues.
    • Helps improve site structure and crawl efficiency.

    Surfer SEO / Clearscope (Content Optimization Tools)

    • Analyze top-ranking pages to suggest content structure and keyword usage.
    • Help writers create SEO-friendly articles without keyword stuffing.
    • Improve chances of ranking for competitive topics.

    By using these tools together, businesses gain complete visibility into their SEO performance—from technical health and keyword rankings to customer behavior and competitive positioning. This allows companies to plan smarter campaigns, detect problems early, adapt to algorithm updates, and scale growth sustainably.

    SEO tools are not just helpful accessories. They are essential business intelligence systems that guide marketing strategy, content creation, website development, and long-term digital success.

    SEO Helps Small Businesses Compete with Big Brands

    One of the most powerful aspects of SEO is that it levels the playing field.

    Large corporations may have massive advertising budgets, but SEO allows smaller businesses to compete based on relevance, quality, and expertise rather than spending power.

    A well-written guide, a helpful blog post, or a locally optimized service page can outperform big brands in search results.

    This gives startups and local businesses a real chance to attract customers without burning money on continuous advertising.

    Local SEO Drives Real Customers to Physical Businesses

    For businesses that serve specific regions, SEO is even more critical.

    When people search for “restaurant near me” or “Nashville custom home builder” or “IT services in Bangalore,” local SEO determines which businesses appear in maps and local listings.

    Optimizing your business profile, collecting genuine reviews, and using location-based keywords can drive high-intent customers directly to your store or office. collecting genuine feedback via Podium Reviews, and using location-based keywords can drive high-intent customers directly to your store or office

    These users are often ready to take action, which makes local SEO one of the highest-converting digital strategies available.

    SEO Supports Every Stage of the Customer Journey

    SEO is not just about getting clicks. It supports the entire buying process.

    At the awareness stage, people search for general information and solutions.
    At the consideration stage, they compare products and services.
    At the decision stage, they look for reviews, pricing, and trust signals.

    By creating content for each of these stages, businesses can guide customers naturally from interest to purchase.

    SEO allows you to be present throughout this journey, building familiarity and confidence along the way.

    Paid Ads Are Temporary. SEO Is Long-Term.

    Advertising stops working the moment you stop paying.

    SEO, however, continues to deliver traffic and leads long after optimization efforts are completed.

    A single high-ranking article can attract visitors for years. A well-optimized service page can generate consistent inquiries month after month.

    In times of economic uncertainty or budget cuts, businesses with strong SEO foundations remain visible while others disappear from search results.

    SEO Improves Website Quality and User Experience

    Modern SEO is no longer about tricking search engines. It is about creating better websites for real users.

    Google and other platforms now prioritize sites that load fast, work well on mobile devices, are easy to navigate, and provide helpful information.

    By investing in SEO, businesses naturally improve their website design, structure, and usability.

    This leads to lower bounce rates, higher engagement, and better conversion rates.

    Data from SEO Helps Businesses Make Smarter Decisions

    SEO provides valuable insights into customer behavior.

    Businesses can see:

    What people search for
    Which pages perform best
    Which products attract the most interest
    Where visitors come from
    How long they stay

    This data can be used to refine marketing strategies, improve products, and identify new opportunities.

    Data-driven decision-making is essential, and SEO is one of the most reliable sources of customer intelligence.

    SEO Reduces Dependence on Social Media Algorithms

    Social media platforms constantly change their algorithms. A page that reaches thousands of people today may struggle to reach hundreds tomorrow.

    SEO offers more stability.

    Once your content ranks well, it tends to remain visible for long periods with minor maintenance.

    This protects businesses from sudden drops in traffic caused by platform changes.

    SEO Is Critical for Online Reputation Management

    When people search your business name, what they see matters.

    SEO allows you to control the narrative by ranking positive content such as your website, blog posts, case studies, and customer testimonials.

    Without SEO, negative reviews or irrelevant pages may dominate your brand searches.

    Industries Where SEO Is Absolutely Essential

    While SEO benefits every business, it is especially critical for:

    SaaS and software companies
    E-commerce stores
    Digital service providers
    Healthcare and clinics
    Educational platforms
    Real estate businesses
    Financial services
    Local service providers

    In these industries, competition is intense, and customers rely heavily on search before making decisions.

    Common Reasons Businesses Avoid SEO (and Why They Are Wrong)

    Some businesses still hesitate to invest in SEO because they believe it takes too long, is too technical, or is expensive.

    While SEO does require patience, the long-term rewards far outweigh the initial effort.

    Others think social media alone is enough. However, social media captures attention, while SEO captures intent. People searching are usually closer to making a decision.

    Avoiding SEO in 2026 is like opening a store without putting up a signboard.

    How Businesses Can Start with SEO Today

    The first step is understanding your audience and what they search for.

    Next, ensure your website is technically sound, mobile-friendly, and fast.

    Then focus on creating high-quality content that answers real questions related to your industry.

    Optimizing local listings, building trustworthy backlinks, and maintaining consistent branding across platforms further strengthens your presence.

    Even small improvements can lead to noticeable results over time.

    The Future of SEO for Business

    SEO will continue to evolve alongside AI, voice search, and personalization.

    However, the core principle will remain the same: businesses that provide useful, accurate, and accessible information will win.

    Those who invest early will gain authority that becomes harder for competitors to replicate.

    Final Thoughts

    In 2026, SEO is not just about ranking websites. It is about survival, visibility, and sustainable growth.

    Customers depend on search engines and AI tools to make decisions. If your business is not optimized for search, you are invisible to a massive portion of your market.

    SEO helps businesses attract customers, build trust, reduce advertising costs, and grow consistently.

    It is no longer optional.

    It is a necessity.

  • What Is Visual Merchandising? How It Attracts Customers and Boosts Sales

    What Is Visual Merchandising? How It Attracts Customers and Boosts Sales

    In today’s competitive retail world, customers don’t just buy products—they buy experiences. Whether it’s a physical store or an online shop, how products are presented plays a huge role in influencing buying decisions. This is where visual merchandising comes in.

    Visual merchandising is the art and science of displaying products in a way that attracts attention, engages customers, and encourages them to make a purchase. From eye-catching window displays to clean store layouts and appealing online product pages, visual merchandising directly impacts foot traffic, customer behavior, and sales performance.

    In this guide, we’ll explore what visual merchandising is, why it matters, key principles, types, strategies, and how businesses can use it to boost sales and build a strong brand identity.

    What Is Visual Merchandising?

    Visual merchandising refers to the strategic presentation of products, store layout, lighting, colors, signage, and overall aesthetics to make a retail space more appealing and easier to shop.

    Simply put, it’s how you visually communicate your brand and products to customers.

    The main goals of visual merchandising are:

    • To attract customers into the store or website
    • To guide them through the shopping journey
    • To highlight key products and promotions
    • To create a pleasant and memorable experience
    • To increase sales and customer loyalty

    It applies to both brick-and-mortar stores and ecommerce websites, making it a powerful tool for all types of retail businesses.

    Why Visual Merchandising Is Important in Retail

    Retail shoppers make many decisions subconsciously. Studies show that people form impressions within seconds of entering a store or landing on a website. If the space looks cluttered, confusing, or dull, customers may leave without buying anything.

    Here’s why visual merchandising is so important:

    1. Creates a Strong First Impression

    Your storefront or homepage is your first opportunity to grab attention. Attractive visuals invite customers in and build instant trust.

    2. Improves Customer Experience

    Clear layouts and organized displays make shopping easier and more enjoyable. When customers can quickly find what they need, they’re more likely to buy.

    3. Influences Buying Decisions

    Strategic product placement and lighting can highlight high-margin or trending items, encouraging impulse purchases.

    4. Strengthens Brand Identity

    Consistent colors, themes, and designs communicate your brand personality—whether it’s luxury, affordability, eco-friendly, or trendy.

    5. Increases Sales and Conversion Rates

    Better presentation leads to longer store visits, higher engagement, and more purchases per customer.

    How Visual Merchandising Attracts Customers

    Visual merchandising works because it connects with human psychology. People naturally respond to visual cues more than text or technical details.

    Here’s how it draws customers in:

    1. Eye-Catching Window Displays

    A creative window display tells a story and sparks curiosity. Seasonal themes, lifestyle scenes, or new arrivals can instantly attract passersby.

    2. Smart Use of Colors

    Colors influence emotions. For example:

    • Red creates urgency and excitement
    • Blue builds trust
    • Black signals luxury
    • Green represents sustainability

    Choosing the right color palette helps shape how customers feel about your brand.

    3. Lighting That Highlights Products

    Good lighting directs attention to important items and creates a welcoming environment. Spotlights, warm tones, and accent lighting can dramatically change how products look.

    4. Clean and Organized Layout

    Clutter confuses customers. Clear pathways and structured sections help shoppers move comfortably and explore more products.

    5. Visual Storytelling

    Using props, mannequins, and themed displays helps customers imagine using the product in real life.

    How Visual Merchandising Boosts Sales

    Beyond attraction, visual merchandising directly influences purchasing behavior.

    A. Encourages Impulse Buying

    Placing small, affordable items near checkout counters or popular areas increases last-minute purchases.

    B. Highlights Profitable Products

    Retailers can promote high-margin or overstocked items using premium placement and attractive displays.

    C. Increases Time Spent in Store

    The longer customers stay, the more likely they are to buy. A visually pleasing environment keeps them engaged.

    D. Improves Product Discoverability

    Customers are more likely to notice new arrivals and complementary products when displays are well planned.

    E. Builds Customer Loyalty

    A memorable shopping experience encourages repeat visits and word-of-mouth recommendations.

    Types of Visual Merchandising

    Visual merchandising can be applied in several ways depending on the type of retail business, store size, products, and customer expectations. Each type plays a unique role in attracting shoppers, guiding them through the store, and encouraging them to make purchases. Understanding these types helps retailers design better shopping experiences and improve sales performance.

    1. Window Display Merchandising

    Window display merchandising focuses on designing attractive storefront displays that capture the attention of people walking by. It acts as the first visual communication between the brand and potential customers. A well-planned window display can highlight new arrivals, seasonal collections, or special offers while reflecting the brand’s personality and style. By using lighting, mannequins, props, and creative themes, retailers can spark curiosity and motivate customers to step inside the store.

    2. In-Store Merchandising

    In-store visual merchandising refers to how products and spaces are organized within the store. This includes the layout of aisles, placement of shelves, use of signage, positioning of counters, and overall store flow. The goal is to make navigation simple and shopping enjoyable. When customers can easily find what they are looking for and discover new products naturally, they tend to spend more time in the store, which often leads to higher sales.

    3. Product Display Merchandising

    Product display merchandising concentrates on how individual products or collections are showcased. Instead of displaying everything at once, retailers highlight selected items using special tables, shelves, or brand-focused sections. This approach draws attention to premium products, new launches, or discounted items and helps customers quickly understand what is important or trending in the store. It also supports cross-selling by placing related products near each other.

    4. Mannequin Merchandising

    Mannequin merchandising is widely used in fashion and lifestyle retail to help customers visualize how clothing and accessories look when worn. Mannequins create real-life styling examples that inspire outfit ideas and encourage shoppers to purchase complete looks rather than single items. When placed near entrances or in window displays, mannequins also serve as powerful visual tools to attract foot traffic.

    5. Point-of-Purchase Merchandising

    Point-of-purchase visual merchandising focuses on the checkout area where customers finalize their purchases. This space is strategically used to display small, affordable, and complementary items that encourage impulse buying. Products placed near the billing counter often receive attention while customers wait in line, increasing the chances of additional sales without much effort.

    6. Seasonal Visual Merchandising

    Seasonal visual merchandising involves updating store displays to match festivals, holidays, weather changes, or special events. Retailers redesign their stores during occasions such as Diwali, Christmas, summer sales, or back-to-school seasons to stay relevant and appealing. These time-based displays create urgency and emotional connection, making customers more likely to shop during limited periods.

    7. Thematic or Concept-Based Merchandising

    Thematic merchandising uses a specific concept or story to design product displays. For example, a store may create a travel theme, eco-friendly lifestyle theme, or luxury living concept to emotionally connect with customers. Instead of just showing products, this approach builds a narrative that helps shoppers imagine how the products fit into their daily lives. It also strengthens brand identity and creates a memorable in-store experience.

    8. Digital Visual Merchandising

    Digital visual merchandising is essential for ecommerce stores and modern retail environments. It includes website design, product photography, homepage banners, navigation structure, category pages, and even digital screens inside physical stores. Since online shoppers cannot physically touch products, high-quality visuals and user-friendly layouts play a major role in building trust and increasing conversion rates.
    Tools that allow retailers to remove objects from photos have become invaluable for digital merchandisers, enabling them to present clean, distraction-free product visuals that drive higher conversion rates.

    9. Sensory Visual Merchandising

    Sensory visual merchandising combines visual design with other sensory elements such as lighting, music, colors, and spatial arrangement to shape the overall atmosphere of a store. While multiple senses are involved, visual presentation remains the foundation. For example, luxury stores often use soft lighting and elegant colors, while fast-fashion brands prefer bright lights and bold visuals to create energy and excitement.

    10. Sustainable Visual Merchandising

    Sustainable visual merchandising focuses on using eco-friendly materials and responsible design practices. Retailers may use recycled props, reusable decorations, and energy-efficient lighting to reduce environmental impact. This approach not only lowers long-term costs but also appeals to environmentally conscious customers and improves brand reputation.

    Visual Merchandising for Ecommerce Stores

    Visual merchandising isn’t limited to physical stores. Online retailers rely heavily on visuals to convert visitors into buyers.

    Key elements include:

    • High-quality product images from multiple angles
    • Clean website layout and easy navigation
    • Clear categories and filters
    • Consistent branding
    • Attractive banners and featured collections
    • Mobile-friendly design

    Well-designed ecommerce visual merchandising improves trust and reduces bounce rates.

    Visual Merchandising Strategies That Work

    Successful visual merchandising is not just about making a store look attractive. It is about using smart, proven strategies that guide customer behavior, highlight the right products, and ultimately increase sales. Below are some of the most effective visual merchandising strategies used by modern retailers.

    A. Use the Rule of Three

    The rule of three is a simple yet powerful design principle that states that objects arranged in odd numbers, especially three, are more visually appealing and memorable to the human eye. When products are displayed in groups of three, they naturally create balance and harmony, making the display look organized rather than crowded. Retailers often use this technique on feature tables, window displays, and promotional shelves to draw attention to key items without overwhelming customers.

    B. Tell a Story Through Displays

    Instead of placing products randomly on shelves, effective retailers use storytelling to create emotional connections. Lifestyle-based displays help customers imagine how a product fits into their everyday life. For example, a custom clothing store may design a display showing a complete outfit for office wear or a weekend trip, while a home décor store may recreate a cozy living room setup.

    Similarly, a jewellery brand like Ice Cartel can curate elegant showcases that tell a story of luxury and personal style—such as pairing statement pieces with occasion-based themes like weddings, parties, or everyday glam.Story-driven displays make shopping more engaging and encourage customers to buy multiple related items.

    C. Leverage Customer Behavior Data

    Modern visual merchandising relies heavily on data and customer insights. Retailers analyze foot traffic patterns, heat maps, and purchase behavior to understand which areas of the store receive the most attention. High-traffic zones are ideal for placing bestsellers, new arrivals, or high-margin products. This strategy ensures that the most profitable items get maximum visibility, increasing the chances of conversion and improving overall sales performance.

    D. Rotate Displays Regularly

    Keeping displays fresh is essential to maintain customer interest. When shoppers see the same setup repeatedly, it becomes invisible over time. Regularly changing product placements, themes, and featured collections gives customers a reason to explore the store again. Seasonal updates, weekly promotions, or monthly refreshes help create a sense of novelty and urgency, encouraging repeat visits and impulse purchases.

    E. Invest in Visual Merchandising Tools

    Professional tools significantly enhance the effectiveness of visual merchandising. Mannequins help customers visualize how products will look when used or worn. Signage communicates offers and guides customer movement. Quality design and print materials like promotional posters, shelf signage, and branded banners help maintain visual consistency and elevate the professional appearance of your displays.
    Likewise mirrors improve the shopping experience in fashion stores, while digital screens can showcase promotions, brand stories, or product videos. Props and decorative elements add depth and personality to displays, making the store environment more immersive and memorable.

    F. Train Staff to Maintain Displays

    Even the best-designed displays lose their impact if they are not properly maintained. Staff training is crucial to ensure shelves stay organized, mannequins remain well-dressed, signage is updated, and damaged displays are fixed quickly. When employees understand the importance of visual merchandising, they naturally contribute to keeping the store attractive and customer-ready at all times. This consistency directly affects customer perception and brand credibility.

    Common Visual Merchandising Mistakes to Avoid

    • Overcrowded shelves
    • Poor lighting
    • Inconsistent branding
    • Ignoring customer flow
    • Outdated or dusty displays
    • Lack of signage or price tags

    Avoiding these mistakes can significantly improve customer satisfaction.

    FAQs on Visual Merchandising for Businesses

    1. How does visual merchandising increase sales?
    It improves product visibility, guides customers, and encourages impulse buying.

    2. Is visual merchandising useful for small businesses?
    Yes, it helps any store look professional and attract more customers.

    3. How often should displays be updated?
    Every 2–4 weeks or during new launches and seasons.

    4. Does visual merchandising apply to online stores?
    Yes, through website layout, images, banners, and navigation.

    5. What are the key elements of visual merchandising?
    Product placement, lighting, layout, colors, and signage.

    6. Is a big budget required?
    No, simple organization and creative displays can be effective.

    7. Can visual merchandising improve brand image?
    Yes, it creates a consistent and recognizable brand experience.

    8. Which businesses benefit the most?
    Retail, fashion, electronics, supermarkets, and ecommerce stores.

    9. Should staff be trained in visual merchandising?
    Yes, to maintain clean and effective displays.

    10. What is the biggest mistake to avoid?
    Overcrowding products and poor lighting.

    Final Thoughts

    Visual merchandising is much more than decorating a store—it’s a powerful marketing strategy that influences how customers feel, think, and buy. When done right, it attracts customers, enhances their shopping experience, communicates brand value, and builds long-term loyalty.
    Whether you run a small local shop or a large ecommerce store, investing in visual merchandising can deliver measurable returns.
    If you want your products to stand out in a crowded marketplace, start by improving how they are seen.

  • Top AI RFP Software for Your Business in 2026 – The Only Guide That You’ll Ever Need!

    Top AI RFP Software for Your Business in 2026 – The Only Guide That You’ll Ever Need!

    If you work in enterprise sales, you know the “Frankenstein Draft.” For those who don’t know about it – it’s a proposal cobbled together from mismatched fonts, conflicting data points, and inconsistent tones – a monster created by too many contributors and zero version control.

    And for a scaling business, this isn’t just a formatting headache but a tangible risk to your brand reputation and win rates.

    For years, we accepted this as the cost of doing business. We bought “RFP Software” , which was essentially just a glorified filing cabinet and a search bar sitting on top of a static library of stale answers.

    But today that definition has changed! 

    In 2026, we aren’t just looking for search anymore; we are looking for reasoning. The new big wave of AI RFP software doesn’t just copy-paste; it reads, understands context, acts like a specialized proposal manager, and lives where your team works.

    So, if you are evaluating your tech stack this quarter, this is your comprehensive guide to the top 8 AI RFP platforms defining the market right now.

    We’ve categorized these tools in the main four categories for easy and clear understanding! 

    Category 1: The AI Agentic Innovators (Reasoning Over Search)

    These platforms represent the newest generation of technology. They don’t just “find” answers; they actively write them based on live data, making them the top AI RFP software for forward-thinking teams. 

    1. Inventive AI

    inventive.ai homepage

    Best For: High-growth revenue teams who need speed and strategic depth.

    Inventive AI has emerged as the standout choice for teams tired of maintaining massive, dusty content libraries. While legacy tools rely on keyword matching, Inventive is built on a “Context Engine” and “AI Agents.”

    And this is their fundamental architectural difference. 

    Instead of asking you to manually upload Q&A pairs, Inventive connects directly to your company’s brain – your Google Drive, Notion, SharePoint, and Salesforce. It indexes this unstructured data and uses it to ground every answer.

    Why it wins on Depth:

    • The “Conflict Manager”: This is a killer feature for anyone who has ever submitted outdated info. Inventive’s AI actively spots contradictions (e.g., “This security answer says we are SOC2 Type 1, but this folder contains a Type 2 report”) and flags them for human review before you generate the draft.
    • Research Agents: It doesn’t just look internal. It employs specialized agents that can analyze a competitor’s public pricing page to suggest “ghosting” strategies in your proposal.
    • 10x Speed: Because it requires less manual “tagging” of content, teams report a 90% reduction in drafting time.

    The Verdict: If you want to move from “managing a library” to “winning deals,” this is the modern choice.

    Pricing: Usage based pricing(Per RFP)

    Reviews: 

    review screenshot

    Overall Rating: 4.9/5 Rated High Performer

    Category 2: The Legacy Heavyweights (Project Management Focus)

    These tools are designed for massive organizations where the primary challenge is coordination across 50+ stakeholders rather than just writing text.

    2. Responsive (formerly RFPIO)

    responsive homapage

    Best For: Global enterprises handling massive volume (RFPs, RFIs, DDQs).

    Rather than an RFP tool, it’s a “Strategic Response Management”platform. It handles RFPs, RFIs, Security Questionnaires, DDQs, and even SOWs.

    • The Superpower: Project Management. If you need to coordinate 50 SMEs across 12 time zones for a single 4,000-question government bid, Responsive gives you the Gantt charts, granular permissions, and sub-tasks you need.
    • The Trade-off: It can feel bloated. For a nimble sales team that just wants to get a proposal out the door, the learning curve is steep, and the implementation can take months.

    Pricing: Contact sales for a custom quote (Pricing varies by seat count).

    Reviews: 

    review screenshot

    Overall ratings: 4.5/5 Stars. 

    3. Qvidian (Upland)

    qvidian homepage

    Best For: Highly regulated industries (Banking, Insurance, Telecom).

    Part of the Upland ecosystem, Qvidian is a legacy player that helps in compliance. If your proposals need to pass through three layers of legal review and adhere to strict formatting standards (like specific font sizes for government bids), Qvidian is a good contender.

    • The Superpower: Document Assembly. It excels at stitching together complex, legally compliant documents where “getting creative” with AI is actually a risk.
    • The Trade-off: The UI feels dated compared to modern SaaS tools, and its “Generative” capabilities are often add-ons rather than core architectural features.

    Pricing: Contact sales for a custom quote. (Subscription-based model)

    Reviews: 

    review screenshot

    Overall ratings – 4.3/5 Stars

    Category 3: The Library Giants (Curation Focus)

    These platforms are excellent if you have a dedicated team of “Knowledge Managers” whose full-time job is to curate and tag content.

    4. Loopio

    loopio homepage

    Best For: Mid-to-Large enterprises with dedicated RFP teams.

    Loopio defined the RFP category for the last decade. It is reliable and well-structured.

    • The Superpower: The “Magic” feature (automation) is good for exact matches. If you have a question that has been answered 100 times before in the exact same way, Loopio will find it instantly.
    • The Trade-off: It struggles with the “Grey Area.” If a question is slightly nuanced or requires synthesizing information from three different documents, legacy library tools often return “No Match” or generic fluff. It relies heavily on you keeping the library clean manually.

    Pricing: Contact sales for a custom quote. (Generally starts around $20,000 annually for its entry-level Foundations plan (10 users), with custom pricing for Enhanced and Enterprise tiers based on company size, features, and needs) 

    Reviews: 

    review screenshot

    Overall ratings – 4.6/5 Stars

    5. Ombud

    ombud homepage

    Best For: Sales-led organizations focusing on “Content Orchestration.”

    Ombud positions itself slightly differently – less as an “RFP tool” and more as a “Revenue Content” platform. It’s designed to help Account Executives find the best slide decks, case studies, and one-pagers, in addition to answering RFPs.

    • The Superpower: Visuals. Ombud handles rich media (images, charts, slides) better than most text-heavy RFP tools, making it a favorite for sales engineering teams.
    • The Trade-off: It can be “overkill” if you just need to answer simple security questionnaires or Excel grids. Because it positions itself as a broader “Sales Content” platform, it often comes with a higher price tag and complexity. If you don’t need the slide generation or sales collateral features, you might be paying for a Ferrari when you just need a delivery van.

    Pricing: Contact sales for a custom quote. (Generally falls in the range of $30 to $100+ per user per month) 

    Reviews: 

    review screenshot

    Overall ratings: 4.7/5 Stars.

    Category 4: The Specialists (Niche & Speed)

    These tools have carved out a specific niche, solving one problem exceptionally well.

    6. HyperComply

    hypercomply hompage

    Best For: High-growth SaaS companies drowning in Security Questionnaires.

    While most tools try to do everything, HyperComply focuses ruthlessly on one thing: Security Questionnaires (VSQs). 

    If your sales engineering team spends 50% of their week filling out 300-row Excel grids for InfoSec reviews, this is the specialist tool you need.

    • The Superpower: Accuracy. They use a hybrid approach where AI fills the pass, but they can also loop in human experts to review the answers, guaranteeing a high acceptance rate from your prospects’ security teams.
    • The Trade-off: It is a niche tool. It isn’t designed to write beautiful 50-page prose proposals or manage complex government bids. It’s a “Grid Filler” specialist.

    Pricing: Contact sales for a custom quote. (Introductory tiers are noted around $500/year (or $1,000/month for growth plans) for basic features, with discounts for startups, while enterprise plans are custom and based on usage) 

    Reviews: 

    review screenshot

    Overall ratings – 4.3/5 Stars. 

    7. RocketDocs

    rocketdocs hompage

    Best For: Financial Services and Security Questionnaires.

    RocketDocs (formerly ResponseFull) has a long history in the banking and security sectors. It is built for “Accurate” response management rather than “Creative” proposal writing.

    • The Superpower: Security Questionnaires. It has specialized features for parsing those nasty, massive Excel-based security grids that every SaaS vendor dreads.
    • The Trade-off: It lacks the “Agentic” flair of tools like Inventive. It’s a tool for filling out forms, not for crafting a persuasive narrative.

    Pricing: Contact sales for a custom quote.

    Reviews: 

    review screenshot

    Overall rating – 4.2/5 Stars. 

    The Real Pain That You Need to Solve with AI RFP Tool – The “Stale Content” 

    person working on pc

    Why do most RFP software implementations fail after 18 months? 

    Because of Content rot.

    In the excitement of Q1, you upload 500 “perfect” answers. By Q4, your product has changed, your pricing model has pivoted, and your security compliance has been updated. Suddenly, your “Source of Truth” is a library of lies.

    This is where the distinction between Inventive AI and the legacy players becomes critical.

    Legacy tools (Loopio, Responsive) rely on humans to manually expire and update content. It’s a chore that no one does. 

    Inventive AI solves this by treating your live documents (Notion, GDrive) as the source. If your Product Manager updates the roadmap in Notion today, Inventive knows about it tomorrow.

    Choose The Best AI RFP Tool, Choose Inventive AI 

    For the last ten years, the RFP market was defined by “Librarians” tools designed to store, tag, and organize static answers. Loopio and Responsive were the kings of that era.

    But in 2026, buying a “better filing cabinet” is no longer a competitive advantage. The bottleneck isn’t finding old answers; it’s synthesizing new, winning narratives from live data.

    While other tools are busy acquiring Salesforce plugins or adding “Generative” buttons to old architectures, Inventive AI is the only platform built natively for the Agentic future. It doesn’t just manage your content; it actively works alongside you to kill the busy work.

    If you are still buying software to organize a library, you are solving a 2015 problem. If you want to solve the 2026 problem of winning more deals with less effort, there is really only one choice.

    Stop managing. Start inventing.

  • Avoid These Mistakes While Setting Up Your Shopify Store 

    Avoid These Mistakes While Setting Up Your Shopify Store 

    Launching a Shopify store is one of the fastest ways to start selling online, but many new store owners make simple setup mistakes that hurt traffic, conversions, and customer trust. From poor store design and missing SEO basics to confusing navigation and weak product pages, these errors can silently reduce sales before your business even gains momentum. Understanding what to avoid during the setup stage helps you build a professional, high-performing Shopify store that ranks better on search engines and converts visitors into loyal customers.

    Starting with the right foundation is essential because your store’s structure, speed, and user experience directly affect how customers perceive your brand and how Google ranks your site. By identifying and fixing common Shopify setup mistakes early, you can save time, reduce future redesign costs, and create a smoother shopping experience that supports long-term growth.

    Here are some common mistakes to avoid, ensuring your store starts strong.

    shopify logo and mobile phone

    1. Ignoring Domain Configuration and DNS Setup

    When setting up your Shopify store, one common rookie mistake is skipping proper DNS configuration when connecting your custom domain. Always check DNS records to ensure they point correctly to Shopify’s servers.

    A custom domain hosting a Shopify store must point to Shopify’s servers. To do that, proper DNS records need to be set up. If that’s not done correctly, your store may appear to be offline or give SSL errors. 

    The real problem here is that it’s easy to miss improper records. To verify that your records are correct, you need to do a DNS lookup. This is possible with free online tools that can check any public domain’s records. 

    The critical records to check here are the following:

    • A/AAAA records (map domain names to IP addresses)
    • CNAME records (responsible for pointing your domain to Shopify)
    • TXT records (used for domain verification)

    So, don’t overlook this crucial step.

    2. Using Default or Unbranded Themes

    A store should look professional and well-made. That’s because impressions can make or break your store’s reputation. When launching a new store, you lack credibility, so you must win your customers’ trust through your store’s presentation and technical prowess.

    A common mistake many people make is using the default Shopify theme for their store. Or, they use one of the many generic themes available for free.

    This is a mistake because it makes your store appear like a knockoff, which in turn reduces its trustworthiness. Alternatively, building a custom Shopify theme allows you to create a truly unique experience tailored specifically to your brand.

    That’s why you should always make the following changes to your theme:

    • Customize the colors to match those of your brand
    • Add your logo to various places
    • Refine the product page layouts to better suit your brand.
    • Remove elements from the theme that you don’t need

    In this way, you can make your store look unique and professional instead of generic and uninspired.

    3. Forgetting to Optimize Product Images

    Setting up a store is hard work. There are so many product pages to create, so many images to upload, and so many descriptions to write. At the end of it all, you are just happy that it’s over. But it’s not over. You still have to optimize the product images for loading.

    Many people forget this step and upload uncompressed FHD images that take longer to load. The increased loading times can lead to a higher bounce rate of your store and reduce the number of conversions you can get. 

    So, don’t forget to optimize the images. You can achieve this by using an image compressor that reduces the size without compromising too much detail. There are plenty of free options, and you can search for specific tools with queries like “compress JPG,” “compress PNG,” etc.

    Although Shopify offers some image optimization features, manually compressing images is still preferable, as it provides more control.

    4. Neglecting SEO and Meta Details

    A store is only successful if it can be found via search engines. This means that SEO is important for your Shopify store to succeed. However, new store owners often overlook this crucial detail, only to wonder why their store isn’t generating any traffic or conversions.

    Some key strategies to make your products more discoverable are outlined below.

    • Create descriptive URLs for product pages.
    • Use keywords in the product page so that they can be indexed and found on the SERPs.
    • Avoid using numbers and random strings in product names
    • Add meta titles and meta descriptions to each product page

    Doing so will dramatically increase the likelihood of your products being featured on the SERPs.

    5. Not Setting Up Analytics and Tracking

    A key part of running a successful store is analytics. When you can track user behaviour in your store, you can draw valuable insights about which products work, which ones are performing poorly, and even bottlenecks in your sales funnel. 

    However, many people forget this due to either ignorance or forgetfulness. To address this issue, consider integrating Google Analytics and Facebook Pixel from the outset. 

    These tools help track visitor behavior, identify high-performing products, and understand where your traffic comes from, allowing you to modify your marketing efforts accordingly.

    6. Overlooking Mobile Optimization

    Since Shopify stores are primarily created on PCs and laptops, beginners often overlook the need to optimize their stores for mobile devices. After all, in 2025, more than half of the internet’s traffic comes from mobile devices.

    That’s why you should test your store’s responsiveness, check how buttons look on smaller screens, and see how elements are rearranged from desktop view.

    Don’t forget to test on multiple devices before launch to nail the correct look.

    7. Failing to Create Essential Pages

    Never forget about important pages on your store like “About Us,” “Contact,” “Return And Exchange Policy,” and “Privacy Policy.” These pages are central to creating trust among your audience. If you miss them for any reason, people will be hesitant to shop from you, and your store’s performance will suffer.

    It’s not that hard to create these pages; Shopify provides templates that you can personalize. Just ensure they are easily accessible to gain trust quickly.

    8. Not Backing Up Store Data

    Store data needs to be backed up because you always want to have a stable version of your store to fall back on. 

    You may be trying out different versions and themes to see what sticks, but such massive changes can accidentally break your store. In such cases, having a backup is a huge time saver.

    Shopify doesn’t provide backup services, so you will have to arrange for your own. You can back up your data in a variety of ways using different apps. So, use something that works for you and keep your store data safe.

    9. Launching Without Testing Everything

    Finally, before you launch, you must do a test run and a full pre-launch audit. You must check for things like:

    • Page navigation
    • Test hyperlinks
    • Validate DNS propagation
    • Email sender tests
    • Payment gateways
    • Product pages
    • Cart and checkout menus

    Perform test transactions and complete multiple passes of your buying cycle to verify that everything works correctly. Do so on different devices and various kinds of OS to find errors beforehand. 

    If you don’t do this, you will run into customer complaints and issues on day one, and that is terrible for business. So, get that out of the way before launch. 

    online store icons

    Conclusion

    Setting up a Shopify store involves more than just uploading products and going live. There are several things you need to check. 

    In this article, we covered some of the most common mistakes made by new store owners. These include overlooking technical factors like DNS accuracy, SEO, and testing. All of these contribute to building trust and ensuring smooth operations from day one; neglecting them will hinder your store’s success.